Travel Fatigue Metrics: Informing Accumulator Choices Across European Football and NBA Campaigns
Greta Baumann · Oct 22, 2026
Travel Fatigue Metrics: Informing Accumulator Choices Across European Football and NBA Campaigns
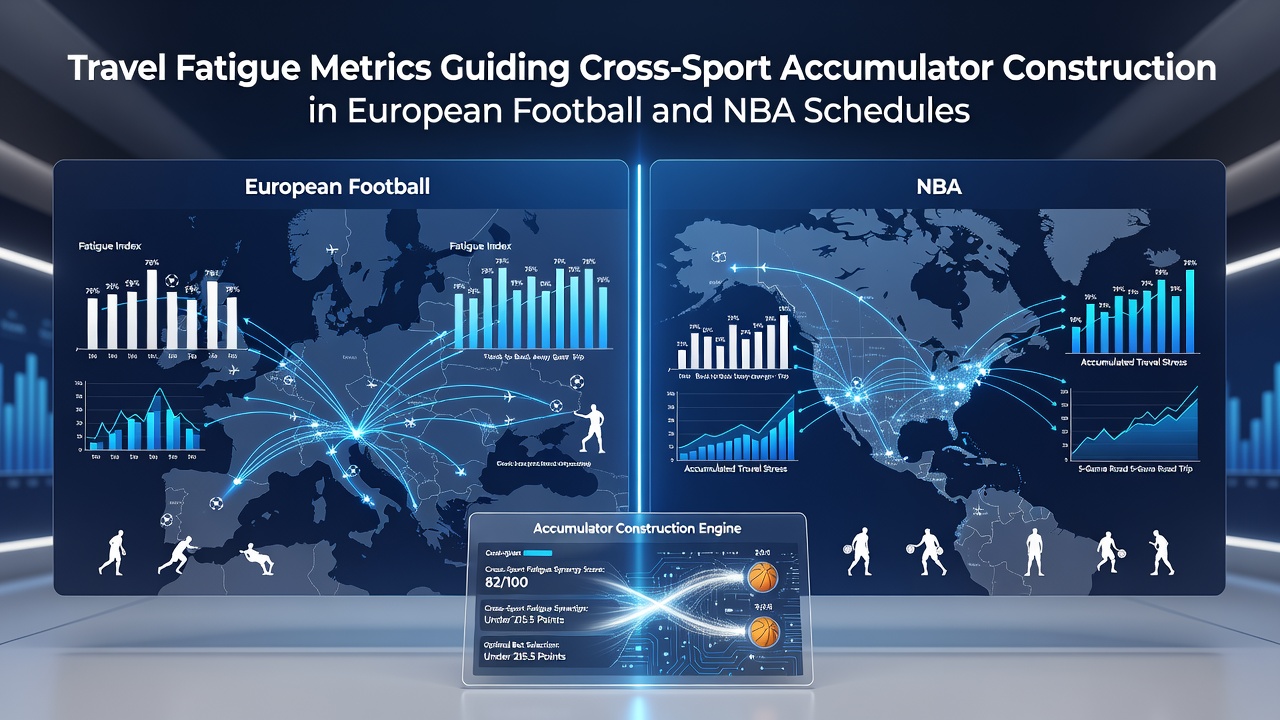
Analysts track travel distance, time zone shifts, and recovery windows when building accumulators that mix European football fixtures with NBA contests, since data from multiple seasons shows measurable dips in performance after extended journeys. European clubs often cover hundreds of kilometers for domestic and continental matches while NBA teams crisscross North America on back-to-back schedules, creating overlapping patterns that bettors examine for value in multi-leg selections.
Researchers at sports performance labs have documented how flights exceeding four hours correlate with reduced sprint output and shooting accuracy in basketball, whereas football teams logging similar distances display higher rates of late-match concessions. These figures feed directly into accumulator models that prioritize underdog outcomes or total points lines when one side arrives with limited rest. October 2026 schedules already feature several high-travel clusters, including NBA Eastern Conference teams heading west immediately after international breaks and European sides returning from midweek Champions League trips before weekend league rounds.
Measuring Travel Load in Different Leagues
Performance databases compile kilometers flown, nights spent away from home, and crossing of multiple time zones for each squad, then compare those inputs against historical results in similar conditions. NBA franchises average more than 40,000 kilometers per regular season while top European football clubs add continental fixtures that push annual travel past 20,000 kilometers in many cases. Observers note that teams with fewer than 48 hours between arrival and tip-off or kickoff post lower win percentages, a trend that accumulator builders apply when pairing selections across the two sports.
Key Variables in Cross-Sport Models
- Distance thresholds that trigger measurable fatigue, typically above 1,500 kilometers for football sides and 2,000 kilometers for NBA clubs
- Time zone changes greater than three hours, which studies link to altered sleep patterns and reduced decision speed
- Back-to-back or three-games-in-five-days sequences that compound recovery demands
- Home versus away splits after travel, showing sharper declines for visiting teams in both leagues
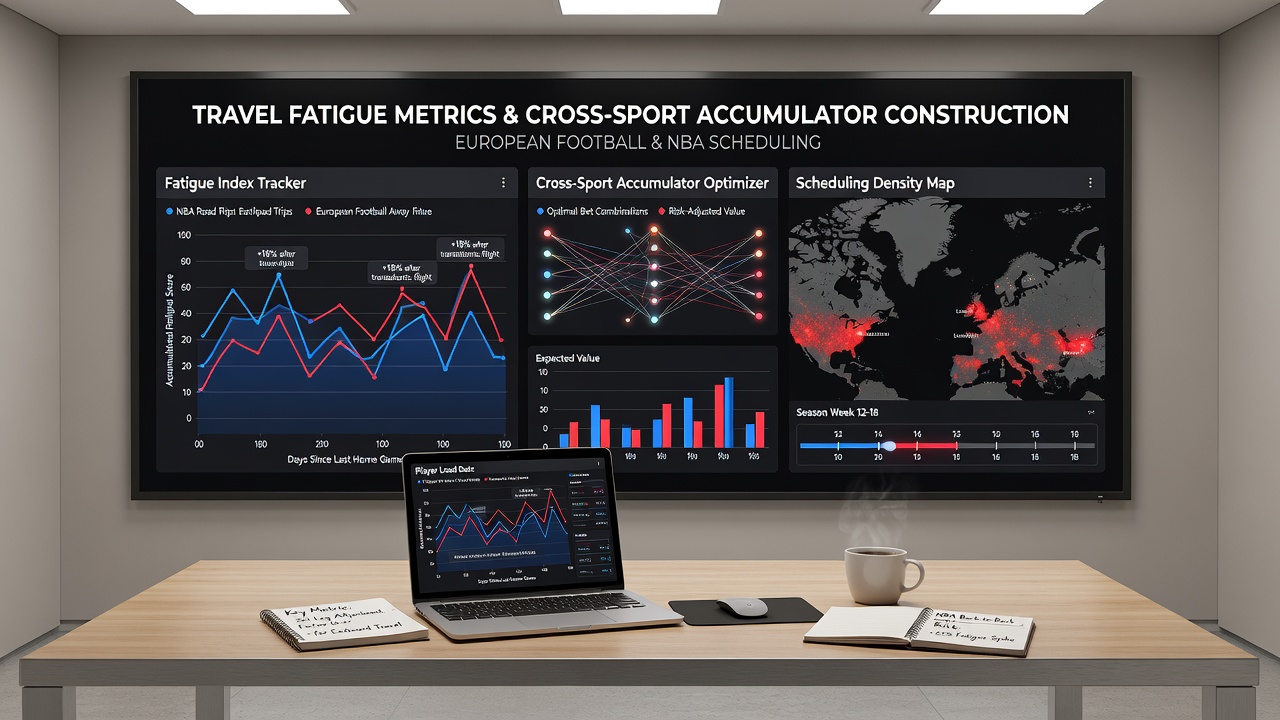
Those variables combine into weighted scores that adjust implied probabilities for accumulator legs, allowing constructors to identify mismatches where one participant faces heavier recent travel than its opponent.
Applying Metrics to Accumulator Construction
Builders start by pulling schedule data for the coming weeks, then overlay travel logs from the prior seven to ten days to flag teams operating under elevated load. A European football side flying from Lisbon to Kyiv for a Europa League tie followed by a domestic match three days later might see its win probability trimmed in models, while an NBA team arriving in Denver after a cross-country flight could face adjusted totals lines. Cross-sport accumulators gain edges when both legs reflect similar fatigue disadvantages, such as pairing a travel-weary Premier League side with an NBA Eastern Conference squad returning from the West Coast.
League-wide datasets reveal that football teams traveling more than 1,200 kilometers midweek win roughly 8 percent fewer matches the following weekend, according to figures compiled by performance analysts. NBA counterparts show parallel drops in points scored per 100 possessions after comparable hauls. These consistent patterns allow accumulator strategies to incorporate travel-adjusted odds rather than relying solely on season averages or recent form.
Seasonal Patterns Emerging in 2026
Early 2026-27 campaigns already illustrate the approach in action, with October featuring compressed schedules on both sides of the Atlantic. European clubs balancing domestic cups and European ties encounter repeated short-turnaround trips, while the NBA opens with several back-to-back sets that coincide with long flights. Accumulator platforms that integrate these metrics report higher hit rates on selections targeting lower totals or away underdogs during peak travel windows, though individual outcomes still vary with roster depth and tactical adjustments.
One case study tracked a Serie A club that covered 3,800 kilometers across nine days in September 2026 before hosting a top rival; the visitors recorded below-average passing completion and conceded from set pieces at elevated rates. Parallel NBA examples show road teams dropping more than six points per game on average after Pacific-to-Atlantic flights with minimal rest. Such granular comparisons help refine accumulator weightings across leagues that otherwise operate on separate calendars.
Conclusion
Travel fatigue metrics supply an expanding layer of data for those constructing accumulators that span European football and NBA schedules, turning schedule analysis into a quantitative component rather than an afterthought. As tracking technology improves and datasets grow, the integration of distance, recovery time, and performance correlations continues to shape how selections combine across the two sports.