Techniques for Mapping Variance in Diverse Sports to Enhance Accumulator Prediction Precision
Morgan Brooks · Aug 27, 2026

Techniques for Mapping Variance in Diverse Sports to Enhance Accumulator Prediction Precision
Analysts apply variance mapping to track how outcomes fluctuate across different athletic competitions and this approach supports more accurate accumulator forecasts by identifying patterns in score margins and result consistency. Data from multiple leagues reveal that high-variance sports such as basketball produce wider ranges of final scores compared with lower-variance events like baseball where results cluster more tightly around expected values.
Core Principles Behind Variance Mapping
Researchers calculate variance by measuring the spread of historical results for each sport then they adjust probability models to reflect those spreads when building accumulator selections. Teams and athletes with consistent performance records show lower variance scores while those prone to dramatic swings receive higher variance ratings that influence the overall risk profile of a multi-leg bet. Studies indicate that combining variance data with standard odds calculations reduces the margin of error in long-term projections by accounting for unexpected deviations that standard models often overlook.
Application in Team-Based Sports
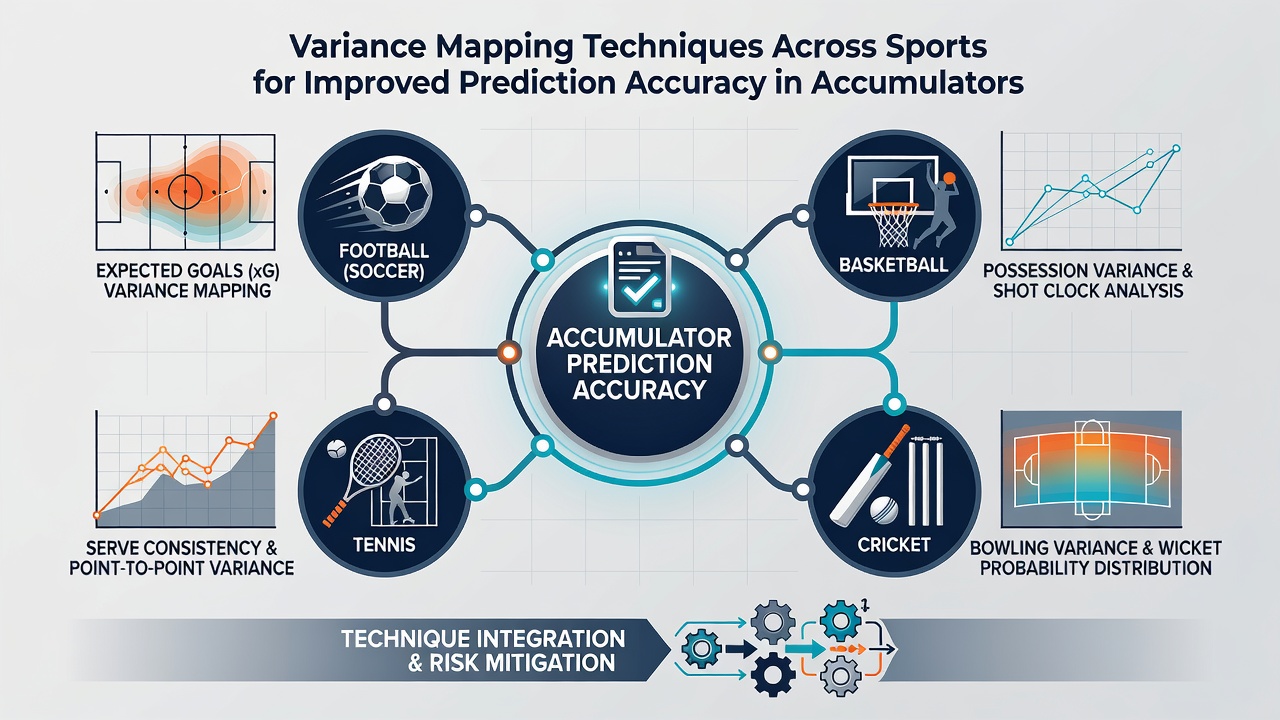
Football analysts map variance through goal differentials and clean sheet frequencies across domestic and international competitions and these maps help forecast how defensive structures affect accumulator outcomes in matches featuring multiple teams. Basketball offers another clear example where point differentials and quarter-by-quarter scoring variance provide detailed inputs for models that predict the likelihood of large upsets or blowouts. Observers note that leagues with shorter seasons such as certain European basketball divisions display elevated variance levels because fewer games amplify the impact of individual performances on cumulative statistics.
Individual Sports and Their Unique Variance Profiles
Tennis presents distinct challenges because match variance depends heavily on surface type player fatigue and head-to-head history so mapping techniques incorporate rally length data and break-point conversion rates to refine accumulator predictions. Golf variance mapping focuses on round-by-round scoring spreads and course-specific factors while horse racing models examine finishing time distributions across different track conditions and distances. These individual-sport approaches allow forecasters to isolate variables that affect single events and then integrate them into multi-sport accumulator structures without overestimating consistency.
Integrating Data Sources for Cross-Sport Analysis
Comprehensive variance maps draw from official league statistics and academic research including work published in the American Gaming Association reports that track performance trends across North American professional leagues. European datasets from organizations such as the European Gaming and Betting Association supply additional context on football and tennis outcomes that helps refine global models. Analysts combine these inputs through weighted algorithms that assign higher importance to recent form while still incorporating long-term variance trends to avoid recency bias in accumulator construction.
Implementation in Accumulator Construction
Betting platforms and independent analysts use variance-adjusted probabilities when selecting combinations for accumulators and this method flags selections where one high-variance leg could disproportionately affect the entire ticket. Software tools now display variance heat maps alongside traditional odds so users see at a glance which combinations carry elevated risk due to mismatched variance profiles across sports. August 2026 data releases from several international competitions have highlighted how variance mapping identified clusters of unexpectedly stable results in certain tennis tournaments that traditional metrics had classified as volatile.
Challenges and Ongoing Refinements
One persistent difficulty arises when transferring variance metrics between sports because rule differences and scoring systems create incompatible data scales that require normalization techniques before comparison. Machine learning models address part of this issue by learning sport-specific weighting factors yet they still depend on large volumes of clean historical data that remain incomplete for newer or less-documented competitions. Those who maintain these systems continue to test adjustments that account for external variables such as weather travel schedules and rule changes that can shift variance patterns mid-season.
Conclusion
Variance mapping has become a standard component of modern accumulator analysis because it supplies an additional layer of statistical context beyond basic win probabilities. Continued collection of granular performance data across football basketball tennis and other disciplines supports incremental improvements in model accuracy and helps forecasters construct selections that better reflect the true distribution of possible outcomes. As more organizations release standardized datasets the precision of cross-sport variance comparisons will likely increase further.